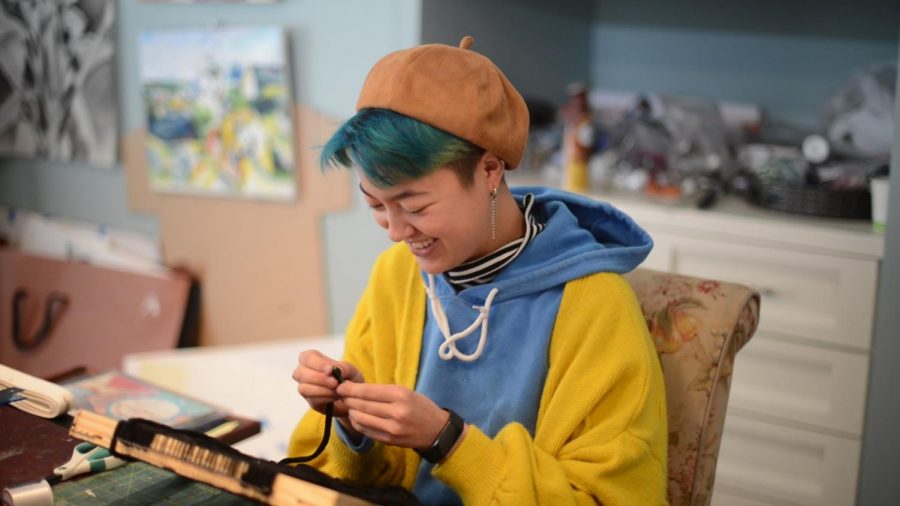
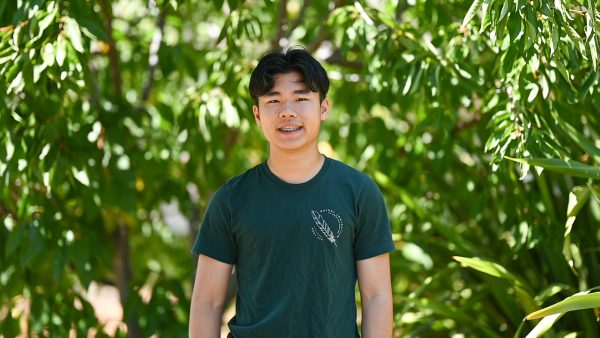
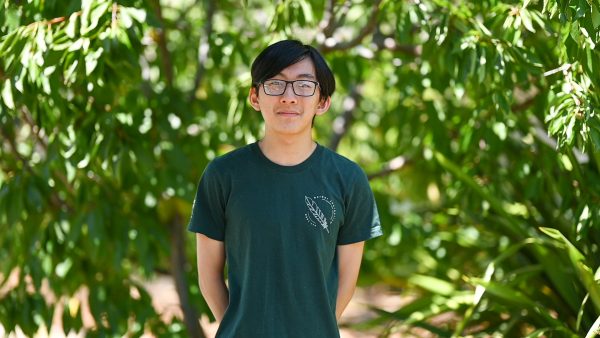
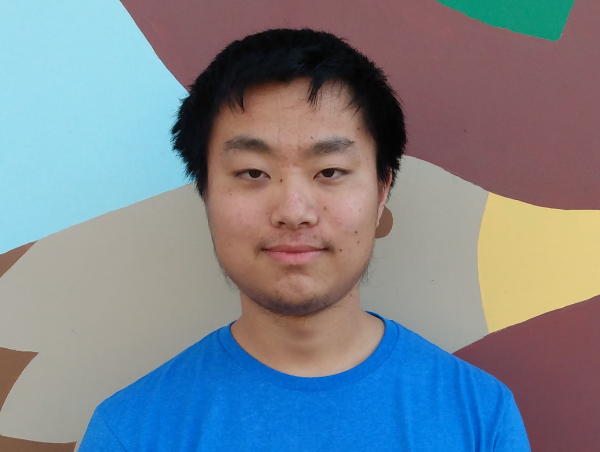
These Q&As were conducted with seniors Andrew Liang, Varun Thvar and Aarush Vailaya, who were selected as top 300 scholars in the 2025 Regeneron Science Talent Search.
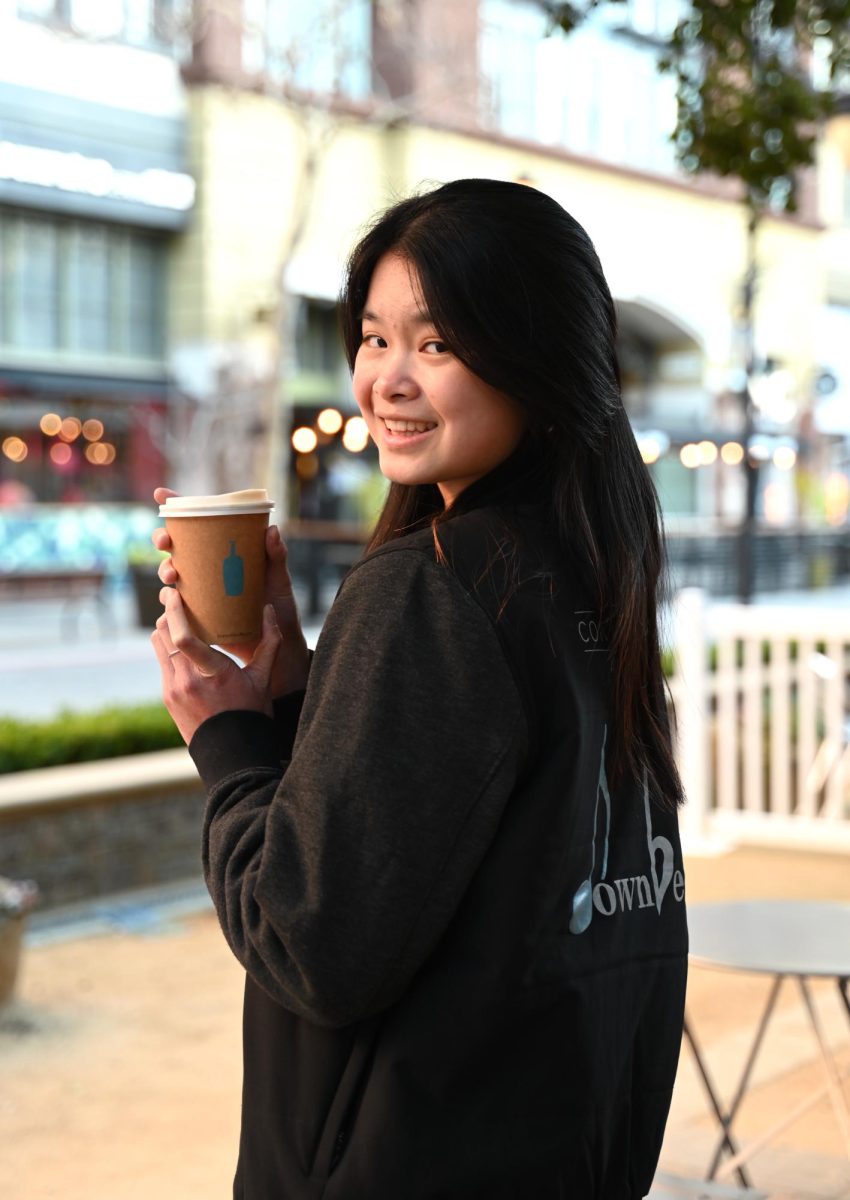
Andrew Liang
Q: What’s your project about?
A: Over the past decade, bee populations have been declining at a really severe rate—close to 40% of beekeepers’ hives die every winter. I’ve tried to find ways to help warn beekeepers of hive stress earlier. The way I chose to do it was this system that monitors the activities of bees going in and out of the hive and records the sounds of bees in the hive. Using those two, I wanted to find the specific behavioral patterns they make under different stressors, for example if the queen is gone or if their hive has pesticides in it. The system can help beekeepers as a first line of defense and warn them if there’s something that might be amiss.
Q: Why did you choose protecting bees as your topic? Do you have a personal connection to bees?
A: I heard of [protecting bees] after I watched a few YouTube videos in the summer of 2022. As I’ve gotten more into beekeeping, I’ve talked with more and more beekeepers, and I’ve also gotten more involved with the bees with my own hives. I found a beekeeper who was selling the hive and bought one from him. Part of the hive split off, grew a new queen, and became a new colony — since then I’ve been taking care of my own hives.
Q: How did you begin your research process?
A: I started with looking around to see what other people have done, and I learned that a lot of people were using either visual-based methods by capturing photos of bees at the entrance and using machine learning to classify [stressors]. Other people had used audio. So I was thinking, “Maybe I can try to combine both of them together, and then this would be more effective in capturing all the nuances of bee behavior.” Then I went to local beekeepers and also took data from my own hives.
Q: What does your system provide for beekeepers?
A: My model gives probabilities for the [stressors], so maybe it gives 80% that [the hive] is healthy, 15% that it’s missing a queen. The most probable one is the most probable condition that the hive is in. My project had four stressors: healthy, missing queens, varroa mites, which is this pesticide that hurts bees by passing viruses, and swarming, which can really weaken a hive. The image model hit around 60% [accuracy], audio around 70%, but the combined [model] was hit greater than 80%. That shows there is useful information in both visual and audio features that a single one isn’t able to fully tell the whole story.
Q: What were the most challenging or surprising parts of your research?
A: Data collection was a big challenge especially because a lot of beekeepers were a bit too good for the project, so finding unhealthy data was not very easy. Overall, I’m surprised at how well the combination worked because they’re very different, and so being able to see the model and find what’s relevant between the images and audio was really fascinating.
Q: What impact do you hope your work may have in the future?
A: I want to talk more with the [Santa Clara Valley] Bee Guild and see if I can test my system on their hives. Eventually, I’m hoping that this will help beekeepers respond to threats quickly. If you’re out in the Central Valley, for example, it might be possible that you live really far away from your bees, and so you might not be able to respond quickly to hive threats. And here in California, agriculture is one of our big [industries], especially in the Central Valley, an agricultural hotspot. So being able to keep bees healthy there is going to be really important, and [the system] could be a big help for going toward a sustainable future.
Q: As an experienced researcher, what advice would you give to other students who are just starting their research journey?
A: Choose a project that you really want to do. Build connections, talk to people who do research, whether it’s your peers or people who are more experienced than you — learn from them. See what they do that you can take in, and they can help you get a better sense of how to become better.
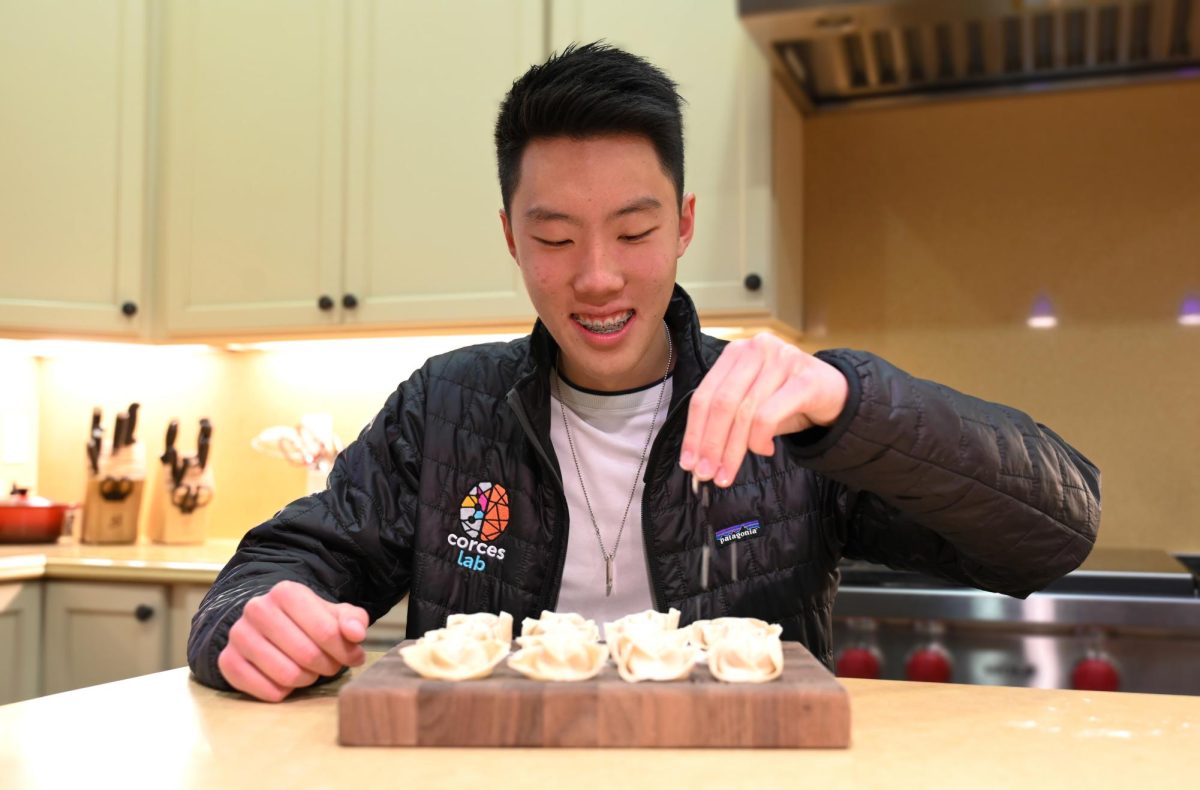
Varun Thvar
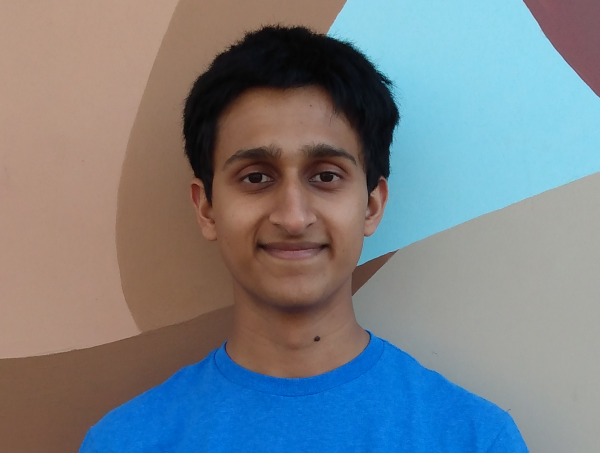
Q: What’s your project about and what was your main goal?
A: In the development of psychiatric disorders, there are typically two types of factors that go into it: some are environmental, like drugs and trauma, and others are biological, which are to do with things like genetics and brain morphometry. My project was about investigating how a specific environmental condition and a type of biological phenomena in conjunction may lead to disorders. So I developed a machine learning approach to look at the relationship between trauma and biology and then how they both affect psychiatric disorders.
Q: Why did you choose this topic?
A: I had done previous research in [psychological] trauma, and I was excited to learn more. In particular, psychiatry has always been either looking at biology or the environment, and so I wanted to look at both. I think it’s very important to look at them in conjunction, because otherwise you’re not getting the full picture.
Q: What steps did you take in your research process?
A: The first step was literature review, knowing what I was getting into, and then developing a methodology. In the first part [of the process], I made five different machine learning models to get very high levels of accuracy predicting childhood trauma from fMRI scans. The second part was creating a deep neural network with the goal of getting the highest accuracy possible for diagnosis even if it meant sacrificing the understanding side, which was marginally better. The last step was developing diagnostic models for psychiatric outcomes of trauma using certain biological features correlated with the trauma.
Q: What were the outcomes of your research?
A: I found that the visuospatial network and the default mode network were the most correlated with trauma. The default mode network is involved in abstract thoughts and your default thinking. The deep learning model had an accuracy of 84%, which is leagues better than what we have in psychiatry because it’s really hard to predict these things with a lot of noise and factors you’re not assessing for.
Q: What impact do you hope your work may have in the future?
A: Being able to diagnose childhood trauma, which is actually really hard because people can over-report or under-report their trauma. If you’re able to have a network that uses brain patterns, it’s much easier to figure out whether someone has trauma based on biology rather than just what they say.
Q: What’s been the most important skill you’ve used in your research?
A: Learning interdisciplinarily. This project had a lot to do with an understanding of psychiatry and neuroscience, but it also had a lot to do with knowing computer science, math and statistics. If you’re able to tell me you know every amino acid and biological phenomena you can think of, we’re not going to get anywhere if you don’t know how to code or do math or know any of the chemistry or physics or engineering. My journey has been a journey of combining fields together, and that’s how I think it should be. At the end of the day, the borders [between sciences] are a lot murkier than you think, and where you look at the borders of those fields is often where the most interesting stuff happens.
Aarush Vailaya
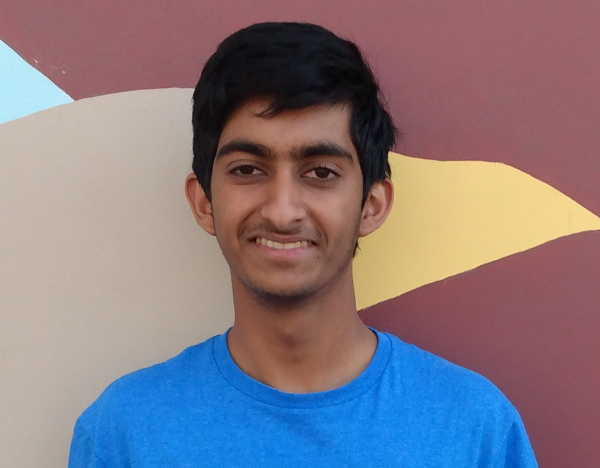
Q: What’s your project about?
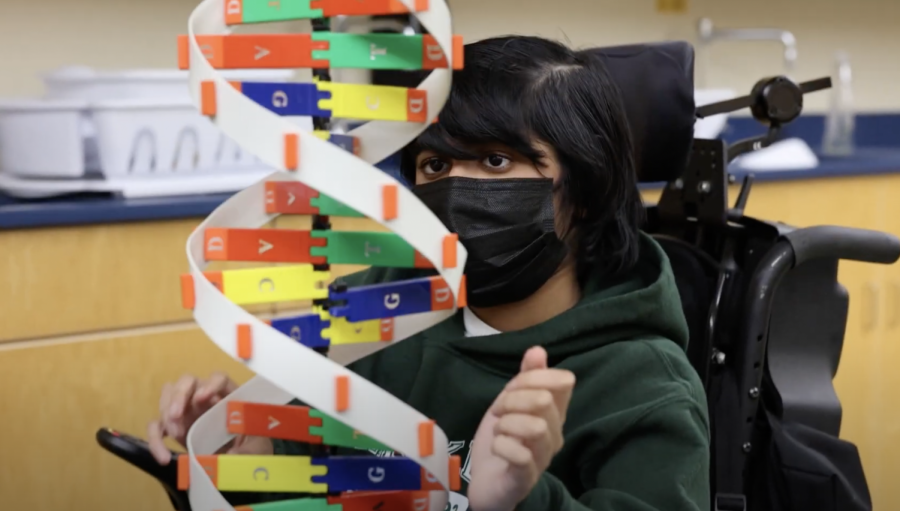
A: My research was on [mathematical] graphs, which are nodes and edges, or lines between the nodes. A “proper coloring” of a graph involves giving each node a color, so that if nodes have a line between them, they have different colors. There’s this object called the chromatic symmetric function, which tells you how you can properly color the graph. Some graphs have this property called e-positivity [dependent on its chromatic symmetric function]. The goal of my research was to find a new family of e-positive graphs to help determine when a graph is e-positive or not. The idea of e-positivity is related to a few other areas in pure mathematics, which is why we study it.
Q: How did you get started on your project, and what got you interested in the topic?
A: There’s this program called PRIMES-USA, a no-cost full-year research program. I was paired with my mentor who introduced me to this topic, and that’s how I started researching.
Q: What steps did you take in your research process?
A: You could imagine that a pure math topic would require a lot of background knowledge, so [my mentor] gave me his 98-page PhD thesis, some textbook and [told me to] read through this. For the next step, he gave me a bunch of graphs and said, “find the chromatic symmetric function.” As I played around, I understood a few patterns and got a better appreciation for the difficulty of the problem. I also played around with my mentor’s method and began realizing if I connect[ed] graphs at adjacent vertices, it seems to be e-positive. I asked my mentor, and he said, “no, no one had this conjecture before,” and so I came up with a computer program that would give an explicit formula for this.
Q: Which part of the project did you enjoy the most?
A: I loved that I could draw examples [of graphs]. I find the topic really cool because while I was working on my math, I could use code to verify what I was doing. I like programming, so let’s say I came up with a formula—I could write a Python script to test it and see if it worked computationally.
Q: What major challenges did you run into during your project?
A: There was another result I was trying to get, which is: I want to connect a new vertex at two edges to a graph and find the chromatic symmetric function for this new graph based on that of the old one. I spent two months on this, and it went nowhere, which was a bummer because I was throwing so much stuff at this problem.. One of the problems with doing research as a high schooler is I don’t have the time to read as much material as my mentor, who did a PhD on this topic, so some of the stuff I discovered was already found before. There were these times when I’d be really excited, and then [my mentor] would tell me this was in a paper that was published 4 or 5 years back.
Q: What was your biggest takeaway from this project?
A: Whenever you’re reading something, write about it. Especially for math papers, formally writing up the things I understood was super useful because let’s say I was going through the textbook and found something I didn’t understand. I could look at each of the definitions, look at what I wrote about those definitions, and all of a sudden it made so much more sense.
Q: What do you wish more people knew about math research?
A: I hope people realize that math research is accessible and also that PhDs are really happy to get people to do research for them. I’m still working with my mentor, and he was really excited to have me helping him with research. It’s a symbiotic relationship. They get people to do research for them, and then we get someone to help us do research.




![“[Building nerf blasters] became this outlet of creativity for me that hasn't been matched by anything else. The process [of] making a build complete to your desire is such a painstakingly difficult process, but I've had to learn from [the skills needed from] soldering to proper painting. There's so many different options for everything, if you think about it, it exists. The best part is [that] if it doesn't exist, you can build it yourself," Ishaan Parate said.](https://harkeraquila.com/wp-content/uploads/2022/08/DSC_8149-900x604.jpg)
![“When I came into high school, I was ready to be a follower. But DECA was a game changer for me. It helped me overcome my fear of public speaking, and it's played such a major role in who I've become today. To be able to successfully lead a chapter of 150 students, an officer team and be one of the upperclassmen I once really admired is something I'm [really] proud of,” Anvitha Tummala ('21) said.](https://harkeraquila.com/wp-content/uploads/2021/07/Screen-Shot-2021-07-25-at-9.50.05-AM-900x594.png)

![“I think getting up in the morning and having a sense of purpose [is exciting]. I think without a certain amount of drive, life is kind of obsolete and mundane, and I think having that every single day is what makes each day unique and kind of makes life exciting,” Neymika Jain (12) said.](https://harkeraquila.com/wp-content/uploads/2017/06/Screen-Shot-2017-06-03-at-4.54.16-PM.png)
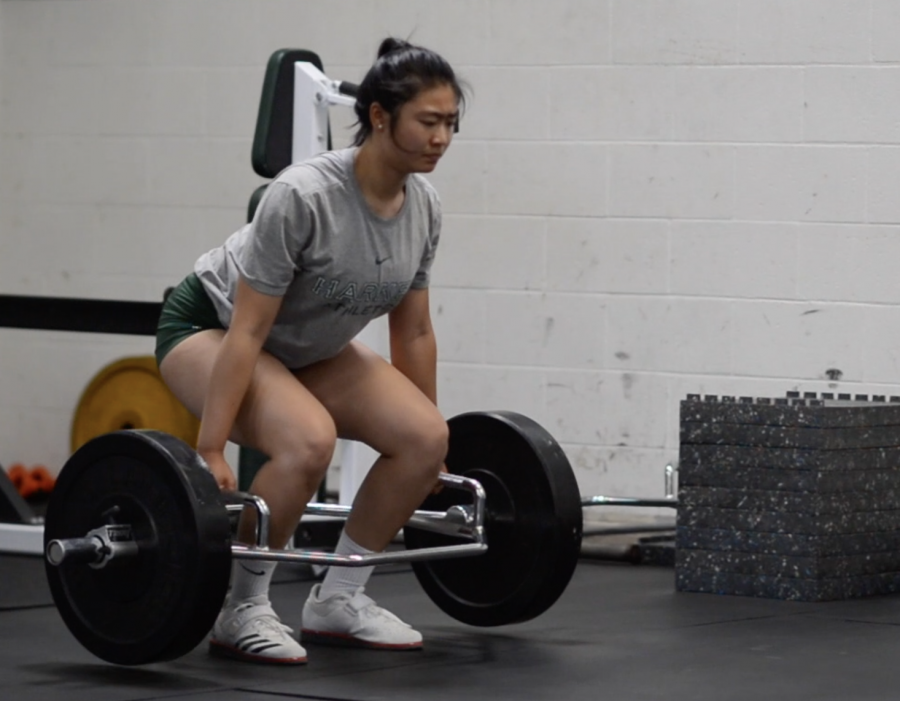

![“My slogan is ‘slow feet, don’t eat, and I’m hungry.’ You need to run fast to get where you are–you aren't going to get those championships if you aren't fast,” Angel Cervantes (12) said. “I want to do well in school on my tests and in track and win championships for my team. I live by that, [and] I can do that anywhere: in the classroom or on the field.”](https://harkeraquila.com/wp-content/uploads/2018/06/DSC5146-900x601.jpg)
![“[Volleyball has] taught me how to fall correctly, and another thing it taught is that you don’t have to be the best at something to be good at it. If you just hit the ball in a smart way, then it still scores points and you’re good at it. You could be a background player and still make a much bigger impact on the team than you would think,” Anya Gert (’20) said.](https://harkeraquila.com/wp-content/uploads/2020/06/AnnaGert_JinTuan_HoHPhotoEdited-600x900.jpeg)
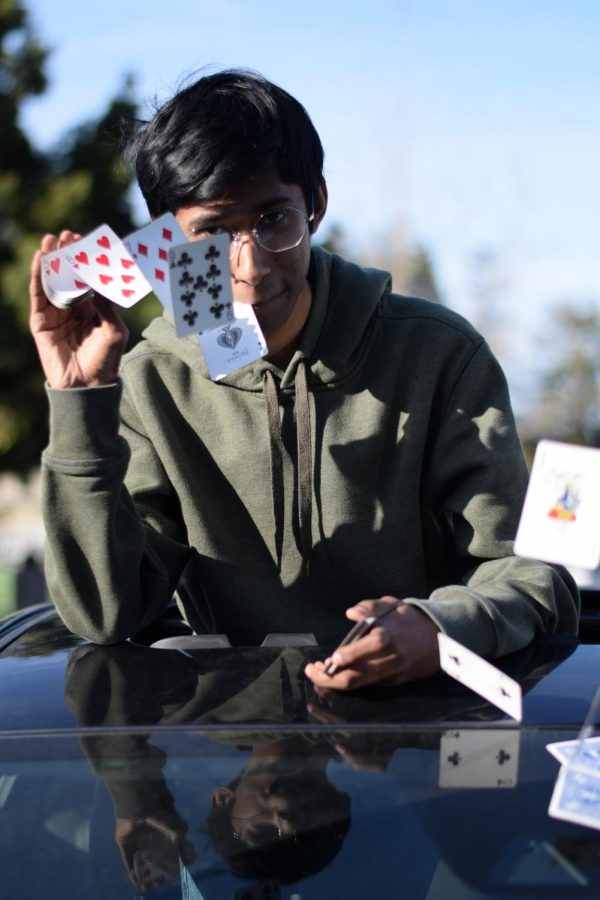
![“I'm not nearly there yet, but [my confidence has] definitely been getting better since I was pretty shy and timid coming into Harker my freshman year. I know that there's a lot of people that are really confident in what they do, and I really admire them. Everyone's so driven and that has really pushed me to kind of try to find my own place in high school and be more confident,” Alyssa Huang (’20) said.](https://harkeraquila.com/wp-content/uploads/2020/06/AlyssaHuang_EmilyChen_HoHPhoto-900x749.jpeg)
